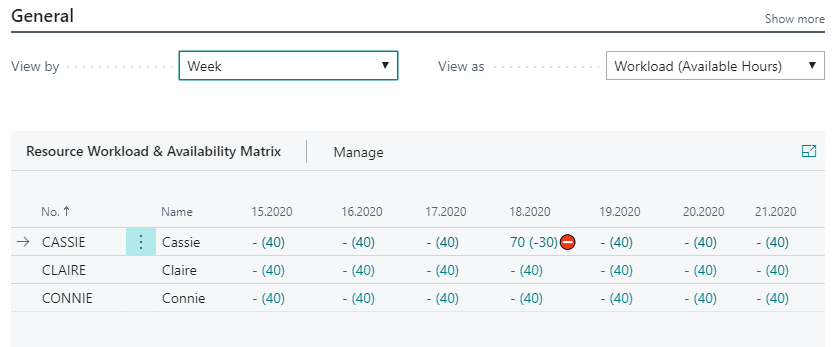
Resource Workload & Availability Analysis view
Working with Project budgeting & planning, Budget Entries are created for which the Resource Workload & Availability Analysis view offers alternative views. The Analysis view is based on the Budget Entry table with additional filters to limit the display such as for Skills, Resource Group or Line Manager.
In parallel with Project planning, a Resource often does their own individual planning in their Outlook calendar. For this purpose, the Analysis View also provides a view of individual Outlook entries.
To access the matrix, choose the  search icon, enter Resource Workload & Availability Analysis, and then choose the related link.
- In the View By field, specify by which period to limit the amounts to display.
- In the View As filed, specify which data to view.
- In the Line Filter FastTab, limit the Resources to view.
- In the Entry Filter FastTab, limit the data to view.
View by filter options
In the View By field, specify the Period to display data. Options:
| Field Name | Description |
|---|---|
| View by options: | |
| - Day | |
| - Week | |
| - Month | |
| - Quarter | |
| - Year | |
| - Accounting Period |
View as filter options
The View As option filter offers the following alternative views of the data:
| View As | Data Displayed | Data Displayed within () | Color visualization |
|---|---|---|---|
| Order | Budget hours where Project Status = Order |
- | Budget hours on order in % of capacity where green >= 75; yellow >= 60; red < 60 |
| Quote | Budget hours where Project Status = Order | - | - |
| Order + Quote | Budget hours where Project Status = Order OR Project Status = Quote | - | Budget hours on Order AND Quote in % of capacity hours where green >= 75; yellow >= 60; red < 60 |
| Calendar | Hours in Outlook calendar | - | |
| Workload (Availability) | Budget hours where Project Status = Order | Available hours, calculated as Capacity hours - Budget hours on Order. | Available hours in % of Capacity hours where red <50 |
Note
Icon alert displayed in Workload (Availability) if Workload hours >110% of Capacity hours.
Line Filter
Line Filters options limit the Resources showed in the matrix.
| Line Filter | Description |
|---|---|
| Resource Group No. |
Displays only Resources connected to the Resource Group(s) within the filter. |
| Line Manager | Displays only Resources connected to the Line Manager(s) within the filter. |
| Skill Filter | Displays only Resources connected to the skill(s) within the filter. |
| Global Dim 1 Filter | Displays only Resources for Global Dimension 1. |
| Global Dim 2 Filter | Displays only Resources for Global Dimension 2. |
Entry Filters
Entry Filter options limit the data displayed for each Resource.
| Entry Filter | Description | |
|---|---|---|
| Project No. |
Displays only data for Project(s) within the Project No. filter. |
|
| Global Dim 1 Filter | Displays only data for Global Dimension 1. | |
| Global Dim 2 Filter | Displays only data for Global Dimension 2 | . |
See Also
Timesheet Status Analysis view