Power BI Reports for Progressus
Progressus provides a data model for Progressus with a base set of reporting packages to be tailored to each business's unique requirements and needs. To access the files:
Click this Request Form link to access the Request Form.
Complete the form to request the Progressus BI Reports (2025-04-15).zip, and click Submit.
An email will be sent to the email address you specified, with a link to download the Progressus BI Reports (2025-04-15).zip. Included in the zipped file are the following files:
- Progressus BI Reports - Dashboard (2025-04-08).pbix
- Progressus BI Reports - Quick (2024-04-29).pbix
- Read Me file with descriptions of what each .pbix file includes.
Tip
Access to download the file via the emailed link is limited to 7 days from the date requested.
Tip
See Project Setup > Power BI Reports to add your own Power BI Reports to the Progressus Project Executive Role Center.
Get Started
In order to work properly, you must have a valid account with Business Central and with Power BI. Also, you must download Power BI Desktop if you wish to create your own Power BI reports. More information about Power BI for Business Central and details on the requirements are described in Enabling Your Business Data for Power BI in Business Central
Install Power BI for Progressus
Use the following steps in Business Central to configure Power BI for Progressus:
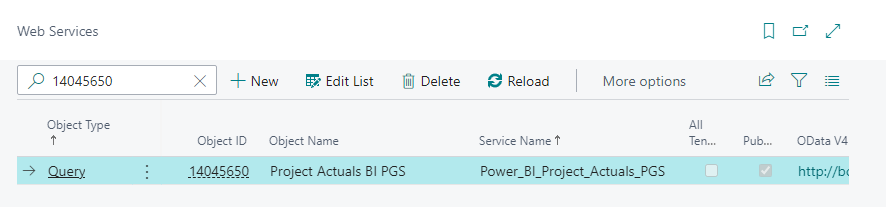
Use the Search tool to search for Web Services and click the related link.
Retrieve ODATA From Business Central Web Services page.
Search in Business Central for the Project Actuals BI PGS Object Id 14045650.
Click on the OData V4 URL (in the following example, just the portion in the box).
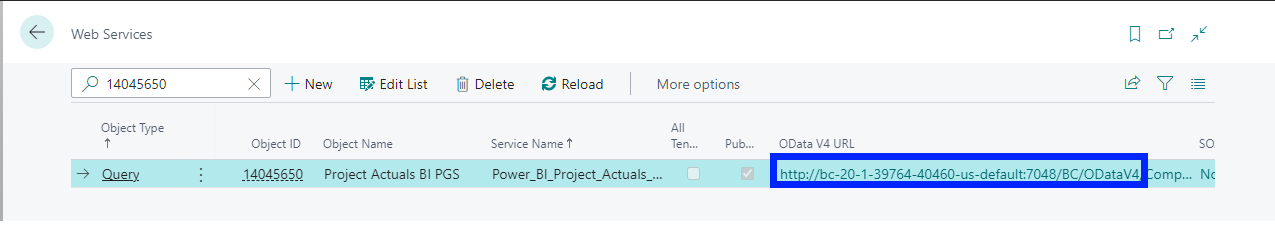

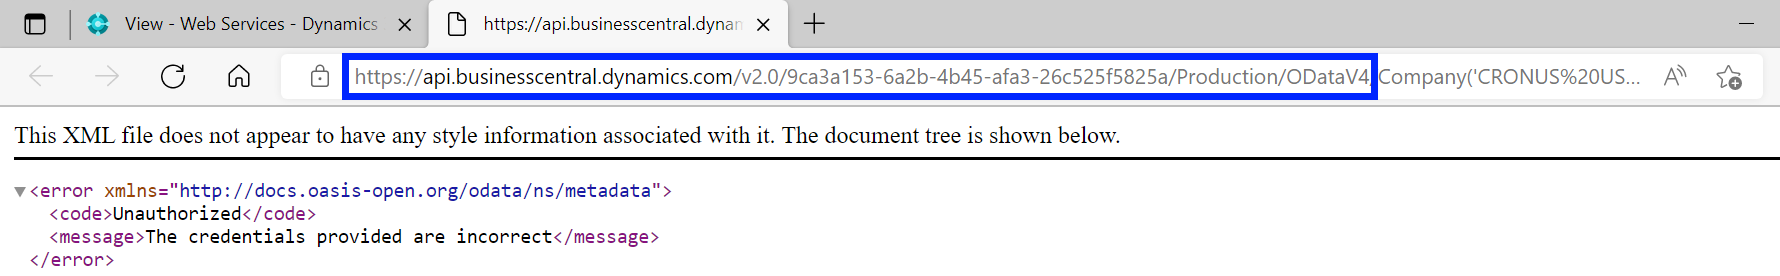
Click Cancel when prompted to login.
Copy the URL up to V4 (this URL will be used in in step 10). Example:
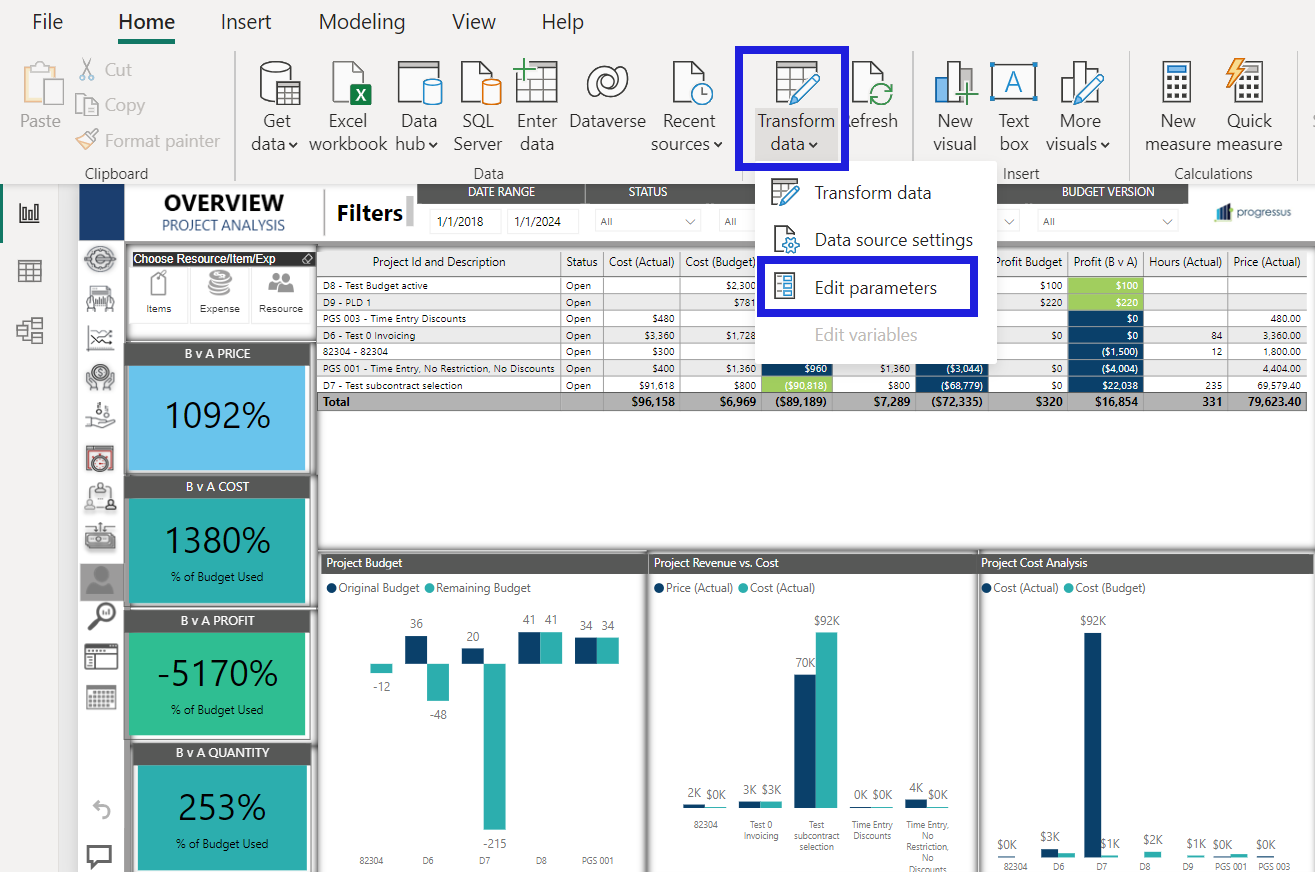
Update the Power BI report with the OData parameter. To do this:
Open the Power BI report in Power BI Desktop.
Note
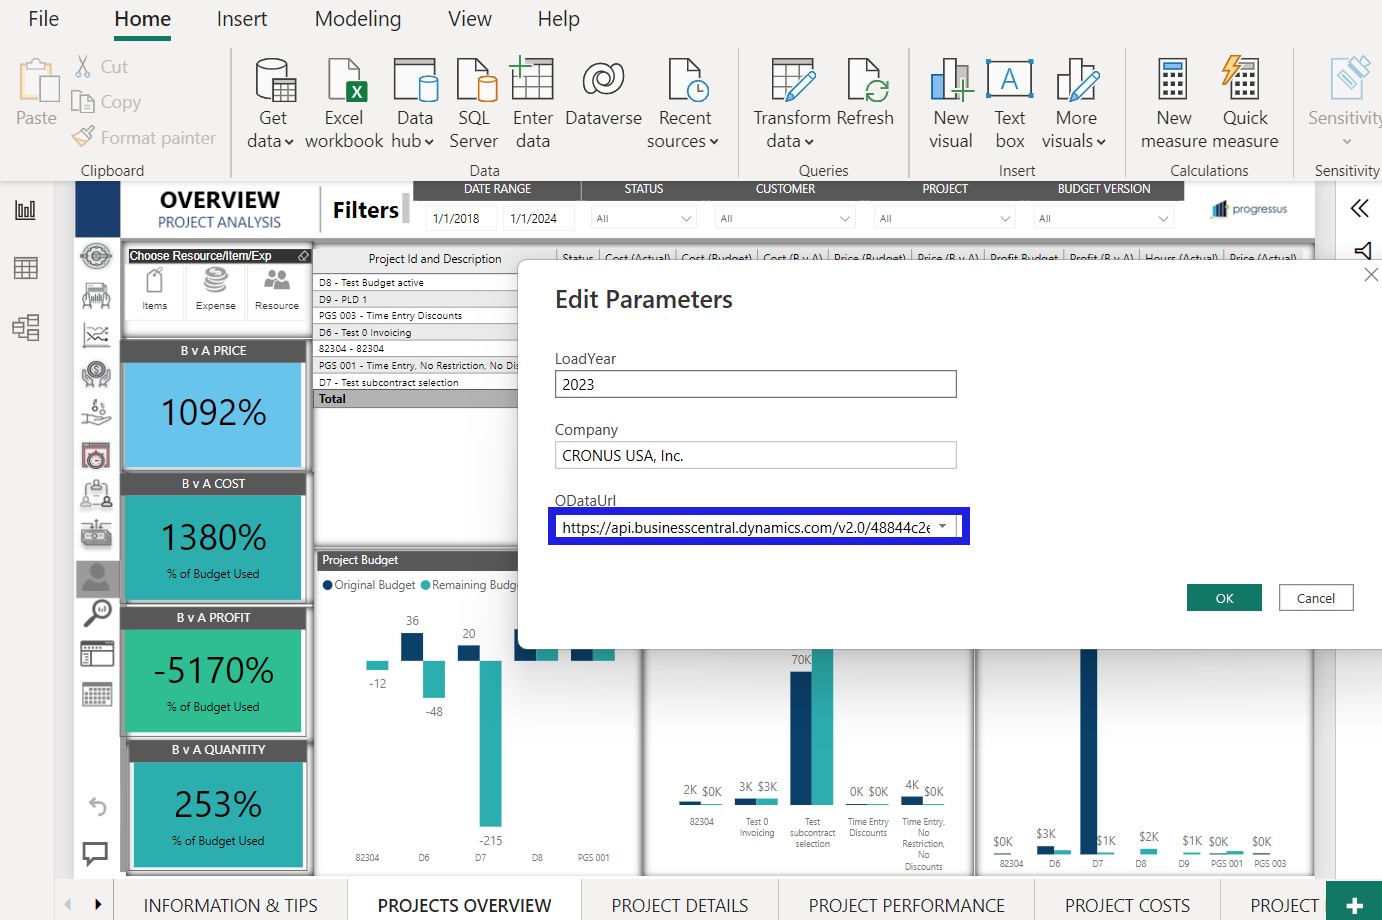
After opening the report in Power BI desktop, the parameters to select the correct BC environment and company must be selected.
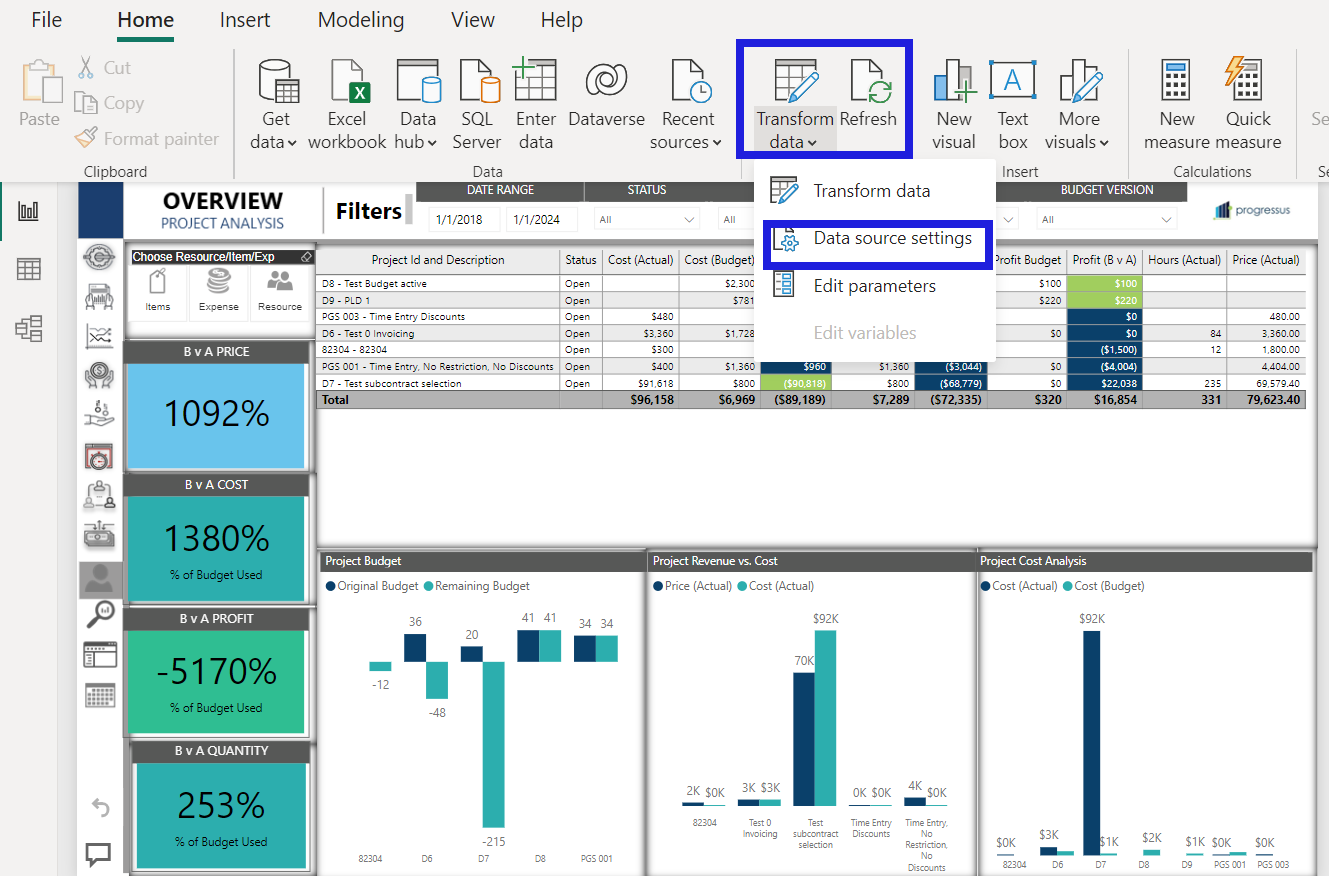
Click on Transform Data – Edit Parameters.
Enter the year, Company name and the OData value from step 6 and click OK.
You are now ready to start using Power BI for Progressus.
Base set of reporting packages
For reports provided:
Hover over any report for specification. Some visualizations have a sub-view with additional information/visualization.
Filter options on the left side: Some data shown are adjusted by date filters, others are independent of specified filters
Definition of Planned is: Budget Entry for the Resource on Projects with Status = Open
Project Overview report
| Section | Description |
|---|---|
| Cost (Act vs Bud) |
Card showing actual cost in % of budgeted cost. |
| Cost (Act vs Bud) | Gauge showing actual cost and budgeted cost in LCY. |
| Profit (Act vs Bud) | Card showing actual profit in % of budgeted profit. |
| % Profit (Act vs Bud) | Gauge showing actual profit % and budgeted profit %. |
| Hours (Plan vs Bud) | Card showing planned hours in % of budgeted hours. |
| Hours (Bud vs Plan) | Card showing budget hours not yet planned. |
| Budget vs Plan (hrs.) | Area chart showing hours budgeted and planned the next 90 days for Projects with Status = Open. |
| Incoming time amount | Stacked column showing Est. Sales Amount in LCY for hours not yet posted |
| Incoming expense amount | Stacked column showing Est. Sales Amount amount in LCY for expenses not yet posted. |
| Ready to invoice | Stacked column showing Sales Amount in LCY per Usage Type ready to be invoiced. |
| Project table | Table showing detailed data per Project. |
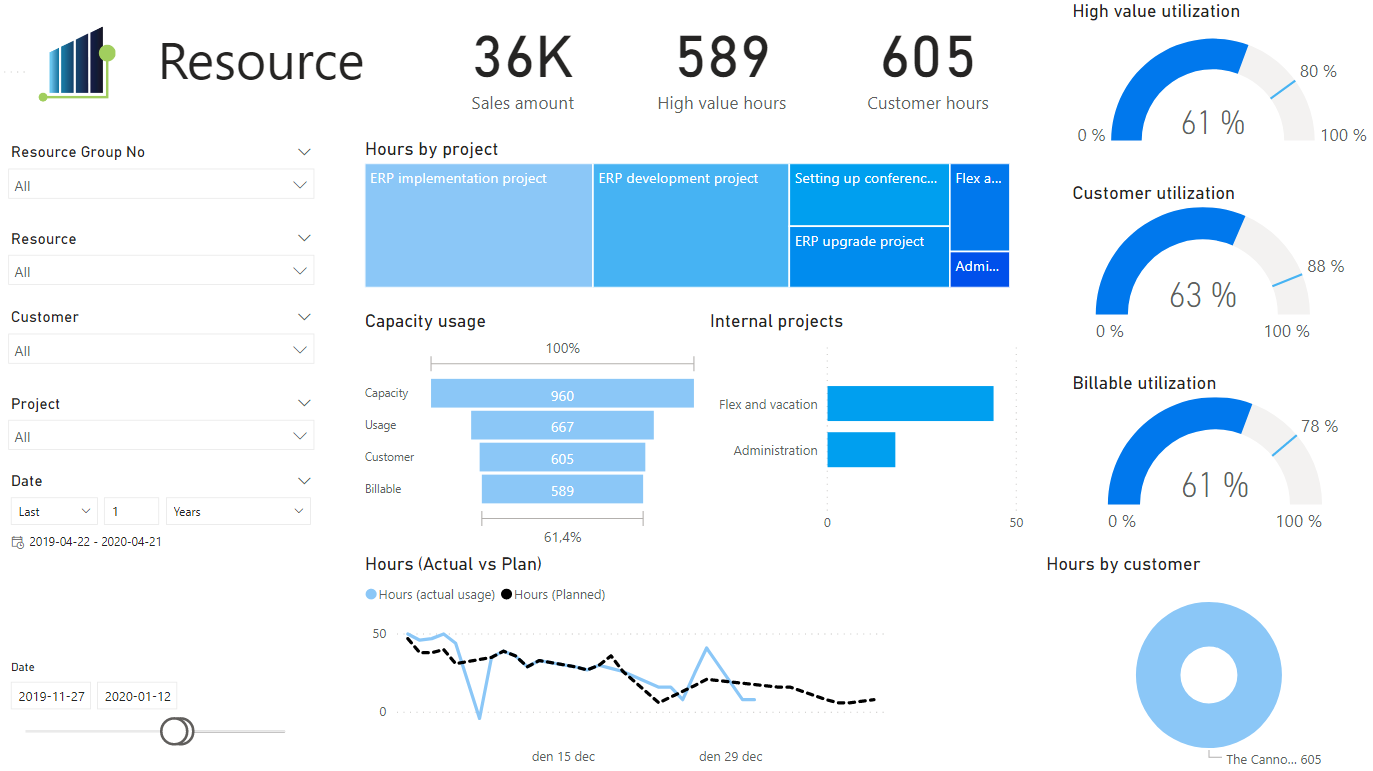
Resource Overview report
| Section | Description |
|---|---|
| Sales amount |
Card showing Sales amount in LCY |
| High Value hours | Card showing hours valued as High Value based on Usage Value Type. |
| Customer hours | Card showing hours on Customer Projects. |
| Hours by Project | Tree map showing hours by Project in relative size. Hover over to see actual hours. |
| Capacity usage | Funnel showing capacity usage in hours. Hover over to see % of capacity and % of previous. |
| Internal Projects | Stacked bar showing hours on Internal Projects. |
| Hours (Actuals vs Plan) | Line chart showing planned hours and actual hours over time. |
| High Value utilization | Gauge showing High Value hours in % of Capacity hours. Target is manually set to 80%. |
| Customer utilization | Gauge showing hours on Customer Projects in % of Capacity hours. Target is based on Client Rate in Forecast Journal. |
| Billable utilization | Gauge showing Chargeable hours in % of Capacity hours. Target is based on Earning Rate in Forecast Journal. |
| Hours by customer | Donut chart showing hours by customer. Hover over each customer to get pie chart with hours by Task. |
Overall Business report
| Section | Description |
|---|---|
| Utilization (High Value) |
Card showing High Value hours in % of Capacity hours. Target is manually set to 80%. |
| Utilization (Customer) | Card showing hours on Customer Projects in % of Capacity hours. Target is based on Client Rate in Forecast Journal. |
| Utilization (Billable | Card showing Chargeable hours in % of Capacity hours. Target is based on Earning Rate in Forecast Journal. |
| Average price/hour | Card showing Average Price per hour in LCY where Contract Type is T&M , calculated as Sales Amount / Hours. |
| Capacity usage | Funnel showing capacity usage in hours. Hover over to see % of capacity and % of previous. |
| Backlog and Pipeline | Stacked area chart showing (i)Backlog (Projects with Status = Open) and (ii)Pipeline (Projects with Status = Quote) - weighted and unweighted based on Pipeline%. Hover over to get specification by Project. |
| Incoming hours | Pie chart showing hours on open per status. Hover over to get specification by Resource. |
| Ready to invoice | Stacked column showing sales amount in LCY per usage type ready to be invoiced. |
| WIP amount | Tree map showing WIP amount in LCY by Contract Type in relative size. Hover over to see actual hours. |
Publish Power BI Reports to Progressus Role Center
To publish a Power BI report from the Progressus Role Center, there are several steps:
- Develop the Report in Power BI Desktop: You must first either develop the report in Power BI Desktop and or use an existing Progressus Power BI Report and connect to your Progressus data.
- Publish the Report to the Power BI service:
- From the Power BI Desktop, use the Publish button to send the report to the Power BI Service (app.powerbi.com)
- If a workspace does not already exist, you will need to create one.
- In Power BI Desktop, select the Publish button on the Home tab.
- Choose (or create) a workspace within the Power BI service as the report destination.
- If you are not signed in to the Power BI service, you will be prompted to do so. You must use the same login as used to login to your tenant.
- Integrate the Report into Progressus:
- Navigate to the Power BI Reports FastTab in Progressus Project Setup.
- Select the ellipse next to Progressus Power BI Report 1, Power BI Report 2 or Power BI Report 1 and choose your newly published Report from the list.
For additional resources on Power BI and connecting your Power BI reports, see:
Building Power BI reports for displaying Dynamics 365 Business Central data