Resource Usage Analysis view
As the timesheet is posted, Usage entries are created in the Project Ledger. The Resource Usage Analysis view is based on Project Ledger Entry table and offers alternative views for Usage entries per Resource.
To access the analysis view, choose the  search icon, enter Resource Usage Analysis, and then choose the related link.
| Filter Name | Description |
|---|---|
| View by |
Specify by which period to display amounts. |
| View as | Specify which data to view. Options: |
| Line Filters FastTab | Enter filters to limit the Resources to view. |
| Entry Filters FastTab | Specify filters to limit the data to view. |
View As filter options
Offers the following alternative views of the data
| View as | Data shown | Data shown in () | Color visualization |
|---|---|---|---|
| Total Hours | Total hours | - | Total hours % of capacity hours where green >=100; black >=90; red <90 |
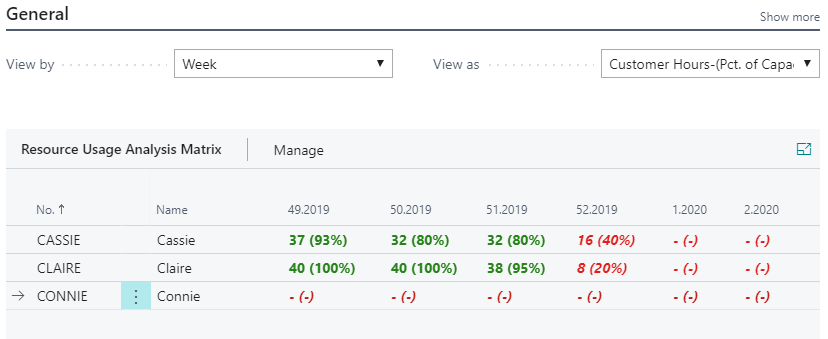
| Customer Hours | Hours where Project Type = Customer. | Customer Hours in % of capacity hours, calculated as Customer Hours /Capacity Hours | Customer Hours in % of Capacity Hours where green >=75; yellow >=55; red <55 |
| Internal Hours | Hours where Project Type = Internal | - | - |
| Billable Hours [High Value?] | Hours where Usage Value Type = High Value | High value hours in % of capacity hours calculated as: High value hours / capacity hours | High value hours % of capacity hours where green >=70; yellow >=60; red <60 |
| Non-Billable Hours [High Value?] | Hours where Usage Value Type = Low Value | - | - |
Line Filters
Line Filters options limit the Resources displayed in the matrix.
| Line Filter | Description |
|---|---|
| Resource Group No. |
Display Resources connected to the Resource Group(s) within the filter. |
| Line Manager | Display only Resources connected to the Line Manager(s) within the filter. |
| Line Department Filter (Global Dim 1) | Display only Resources for Global Dimension 1. |
| Line Project Filter (Global Dim 2) | Display only Resources forGlobal Dimension 2. |
Entry Filters
Line Filters options limit the data displayed for each Resource:
| Entry Filter | Description |
|---|---|
| Project No. |
Display only data for Project(s) within the Project No. Filter. |
| Global Dim 1 Filter | Display only data for Global Dimension 1. |
| Global Dim 2 Filter | Display only data for Global Dimension 2, |
See also
Timesheet Status Analysis view
Resource Workload & Availability Analysis view