Project Gantt Chart
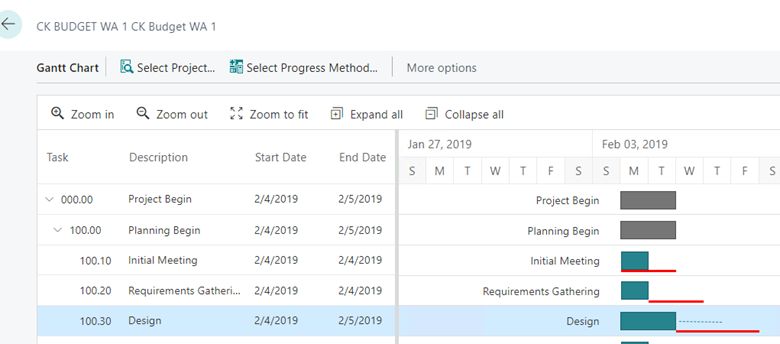
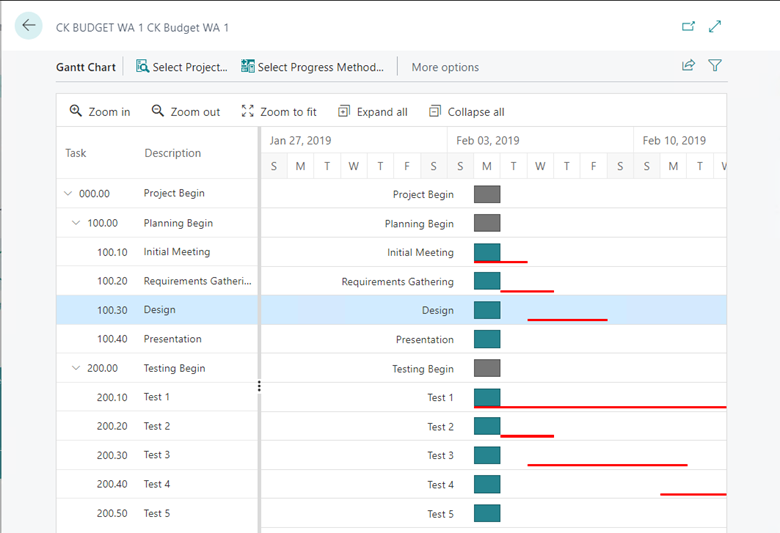
The Project Gantt Chart enables graphical planning of Tasks with drag and drop functionality and color visualization for Usage vs. Budget. The Gantt Chart can be used to create an overview of the Project at the Task level.
Open Gantt Chart
There are different ways to open the Project Gantt Chart:
Access from the Role Center by selecting Actions > Resource Planning > Project Gantt.
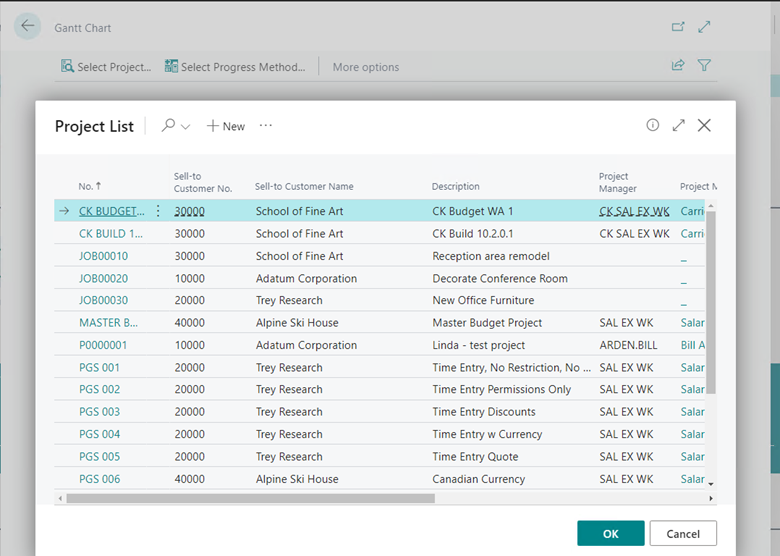
Choose the Search icon, enter Project List, choose the related link. Select a Project to open the Project Plan, or choose Project from the menu to open the Project Card. From either page click on Project > Gantt Chart.
Use the Search icon, enter Project Gantt, choose the related link.
Open Task Card from Gantt Chart
Open the Gantt Chart for a Project. For more information, see: Gantt Chart.
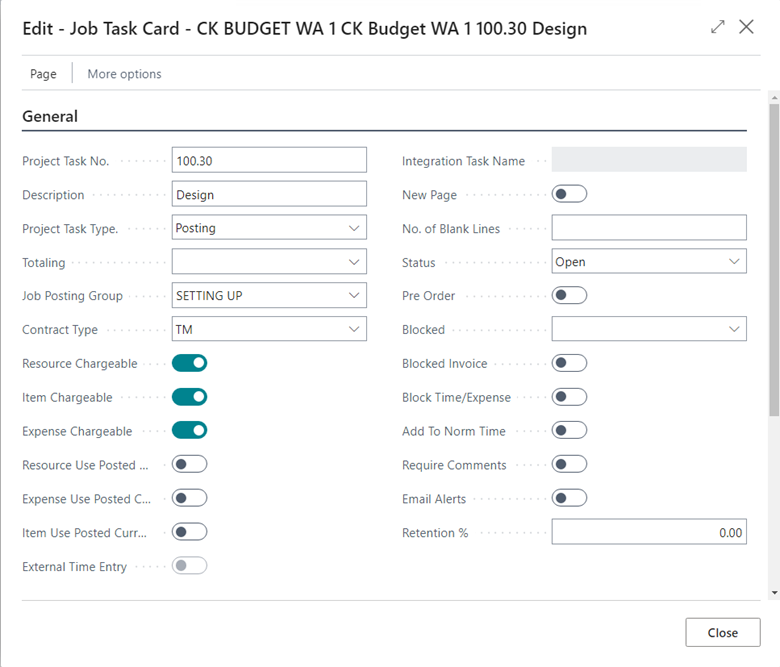
Click the Task Description on the left side of the chart to view General Settings, Start and End (Planning) Dates, Discount, and Invoicing information.
Tip
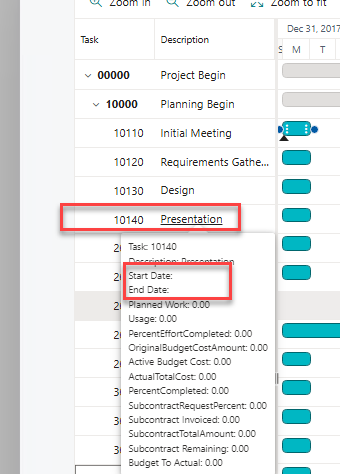
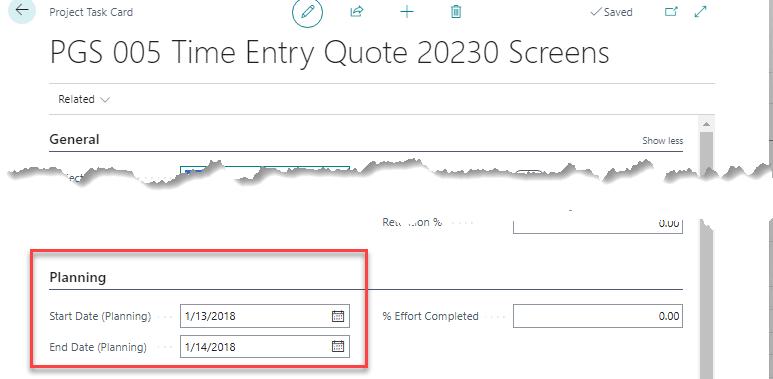
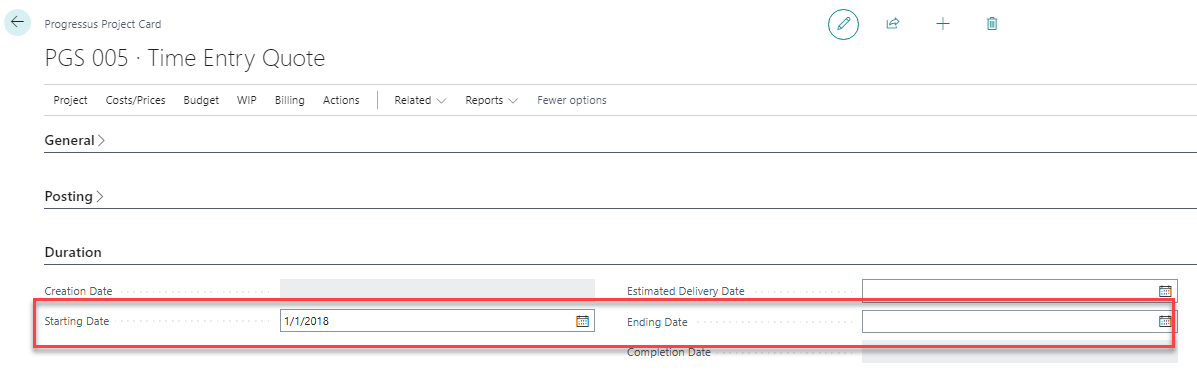
Task and Description Columns: Hover over the Task or Description column to display information about the Task. Note that the Start Date and End Dates fields do not display dates initially by design unless the Dates are already added in the Task Card > Planning FastTab > Start Date (Planning) and End Date (Planning) fields. The actual Start and End Dates of each Task are displayed when the Dates are set for the unplanned task. >
Tip
Bar Chart Column: Hover over the Bar Chart column to display the default Project Task Start Date based on the Duration FastTab on the Project Card, if the Task Start Date (Planning) and End Date (Planning) dates in the Task Card > Planning FastTab are blank. Users can manually change the information by grabbing and moving or extending the dates.
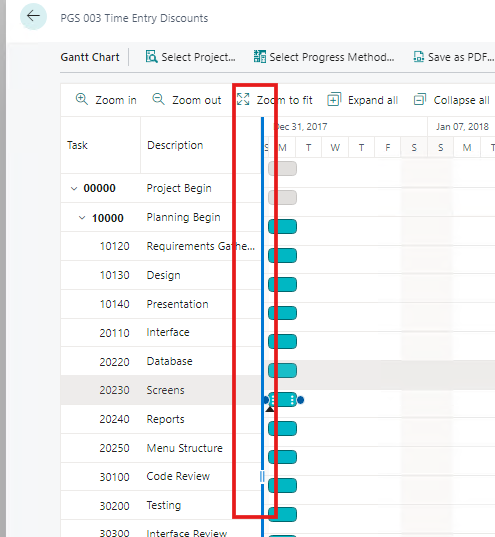
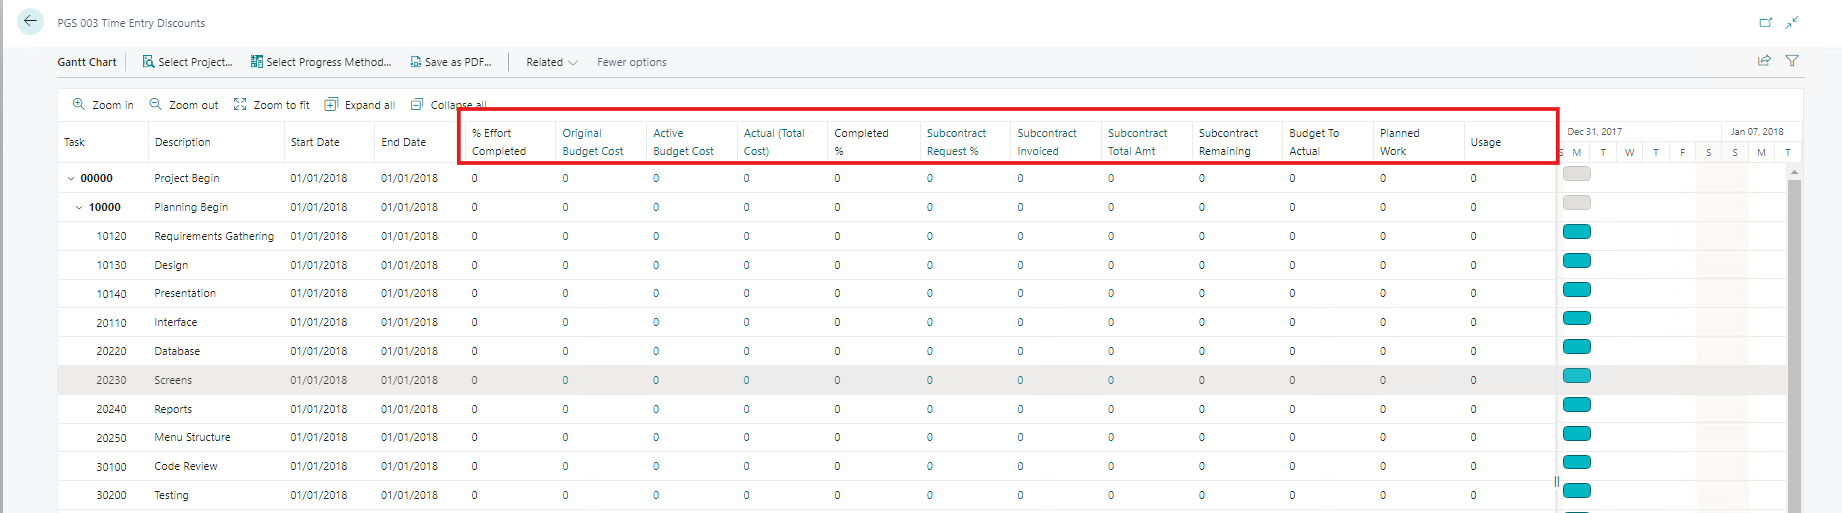
Additional fields with visibility into Budgets, actual costs, Subcontract amounts, and Subcontract Invoices are available. To view these fields, click the solid vertical line between the Description column and the first Date column and slide it to the right.
| Field Name | Description |
|---|---|
| % Effort Completed |
Specifies the percentage of time the Resource has spent on the Task relative to the total amount of time spent on work-related activities. The percentage is manually entered by a Project Manager Resource. |
| Original Budget Cost | Specifies the initial, expected amount, to be incurred, for Resources, Items, or Expenses, to complete the Task. |
| Active Budget Cost | Specifies the amount currently planned for use of Resources, Items, and Expenses for Task completion. If Budget Revisions have not been recorded, the Original and Active Budget costs will be the same. |
| Actual (Total Cost) | Specifies the Total Usage Amount for work posted to the Task for Resources, Items, and Expenses. |
| Completed % | Specifies the calculation of the Total Actual Cost divided by the Active Budget Cost as a percentage of work finished for the Task. |
| Subcontract Request %% | Specifies the Payment Request Amount as a percentage of the Subcontract Amount for the Task. |
| Subcontract Invoiced | Specifies the amount paid, Posted Purchase Invoices, to one or more Vendors, for work on the Task. |
| Subcontract Total Amt | Specifies the Subcontract Total Amt minus Subcontract Invoiced. |
| Subcontract Remaining | Specifies the Subcontract Total Amt minus Subcontract Invoiced. |
| Budget to Actual | Specifies the Amount difference between the Active Budget Cost and the Actual (Total Cost). A negative amount indicates the Actual (Total Cost) exceeds the Active Budget Cost. |
| Planned Work | Specifies the total Quantity of Resource Hours, Budget plus Work Assignments, designated for the Task. |
| Usage | Specifies the quantity of hours, Items, or Expenses posted to the Task. |
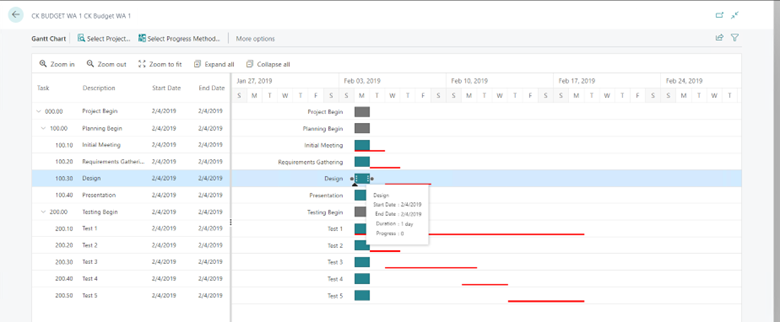
Define Task Dates (drag-and-drop)
Open the Gantt Chart for a Project. For more information, see: Gantt Chart.
Hover the mouse over a Taskbar.
Drag-and-drop the Taskbar to change the Task dates.
Note
The Start Date can be changed by drag-and-drop on the left edge of the Task bar and the End Date on the right edge.
Gantt Chart Ribbon Options
| Ribbon Option | Description |
|---|---|
| Select Project |
Click to display a Project List and choose a Project to view in the Gantt Chart. |
| Select Progressus Method | Select the method to calculate planned/consumed work and progress. Options: |
| - Planned Work vs Usage | |
| - Task Dates vs Days Elapsed | |
| - Budget vs. Usage | |
| Save as PDF | Export the Gantt Chart as a PDF file. |
| Related > Project Card | Opens the Project Card for the current Project |
| Project Events | Opens a list of Project Events for the current Project. For more information on Project Events, see: Create Project Events |
Tip
Project Events can be also be found by using the Search icon and type Job Events.
| Project Task Dependencies |
Opens a list of Project Task Dependencies for the current Project. For more information on Task Dependencies, see: Create Task Dependencies |
Create Project Events
Project Events are used in Resource Planning > Project Gantt > Related > Project Events. Use to default values into the Gantt Chart.
| Ribbon Option | Description |
|---|---|
| Description |
Specifies the description of the Project Event. |
| Date | Specifies the Date of the Project Event. |
| Date Calculated From | Specifies the Project Event from which the current Project Event Date should be calculated. |
| Date Calc. Formula | When completed, the current Project Event Date will be calculated using this formula. For more information on Date Calculation Formulas, see: Work with Calendar Dates and Times |
| Comment | Specifies additional information about the Project Event. |
| Completed | Specifies if the Project Event has been completed. |
| Remind User | Specifies the user that should be reminded about the current Project Event.. |
| Remind User Name | Specifies the Name of the User that should be reminded about the current Project Event. |
| Reminder Formula | The reminder to the user will be issued before the Project Event Date depending on this date formula. |
| Project No. | Specifies the Project for this Project Event. |
| Project Description | Specifies the Project Description for this Project Event. |
| Customer Name | Specifies the Name of the Customer for the selected Project. |
| Mail Reminder Date Sent | Specifies the date and time the e-mail reminder is sent. |
| Mail Reminder Sent | Specifies, if selected (true) that the e-mail reminder was sent. |
Create Task Dependencies
Task Dependencies are the interrelations that exist between Project activities. These Task Dependencies determine the order in which Project Tasks must be executed. For example, some tasks need to be executed in sequence, meaning one Task must be completed before the next can begin.
Task Dependencies
With Task Dependency fields, you can now define how Tasks relate to each other in time so that Planning Dates are calculated automatically when the template is applied to a project. This eliminates manual date entry and ensures consistent planning across projects.
Dependency Fields on Task Lines
Each Task line can include the following fields:
| Field Name | Description |
|---|---|
| Predecessor |
Specifies another Task line that this Task depends on. |
| Relation Type | Defines how the Task is related to its Predecessor: |
| - Finish-to-Start | |
| - Start-to-Start | |
| - Finish-to-Finish | |
| Offset (Workdays) | A positive or negative number of working days: |
| - Positive = lag (delay) | |
| - Negative = lead (overlap) | |
| Duration (Workdays) | The number of working days required to complete the Task. |
Note
All fields are optional. If no predecessor is defined, the task is treated as a root task.
How Working Days Are Calculated
All Offsets and Durations are calculated using working days:
- Weekends are excluded entirely.
- Only weekdays are counted.
Examples:
- A 7-day Offset starting Monday lands on Wednesday of the following week.
- A 5-day Duration starting Monday ends on Friday of the same week.
- Public holidays are not considered.
When Planning Dates Are Assigned
A Task receives calculated Start Date (Planning) and End Date (Planning) when:
- It is part of a Dependency Chain (has a Predecessor or is referenced by one), or
- It has a defined Duration.
If a task has a duration but no dependencies:
- It starts on the Project Start Date.
- Its End Date is calculated based on Duration.
If a task has no Dependency and no Duration, no dates are assigned
Project Start Date as the Anchor
The first Task in each Dependency Chain (a root Task) always starts on the Project Start Date. This behavior cannot be overridden
Date Calculation Logic
Dates are calculated when the Task Template is applied to a Project.
The system:
- Orders Task lines based on Dependencies.
- Starts with root Tasks using the Project Start Date.
- Calculates all Dependent Tasks in sequence.
Calculation Rules by Relation Type
- Finish-to-Start
- Start = Predecessor End + Offset + 1 working day
- End = Start + Duration − 1
- Start-to-Start
- Start = Predecessor Start + Offset
- End = Start + Duration − 1
- Finish-to-Finish
- End = Predecessor End + Offset
- Start = End − Duration + 1
- Start-to-Finish
- End = Predecessor Start + Offset
- Start = End − Duration + 1
Note
Note: For Finish-to-Start with Offset 0, the Successor always begins on the next working day after the Predecessor ends.
User Interface
The following fields are available on the Task Template Line page:
- Predecessor
- Relation Type
- Offset
- Duration
The Predecessor field includes validation to prevent circular dependencies during entry.
How to use the Gantt Chart
Open the Gantt Chart for a Project.
Hover the mouse over a Taskbar to display two gray circles at the beginning and end.
Hover the mouse over one of the gray circles until it is white.
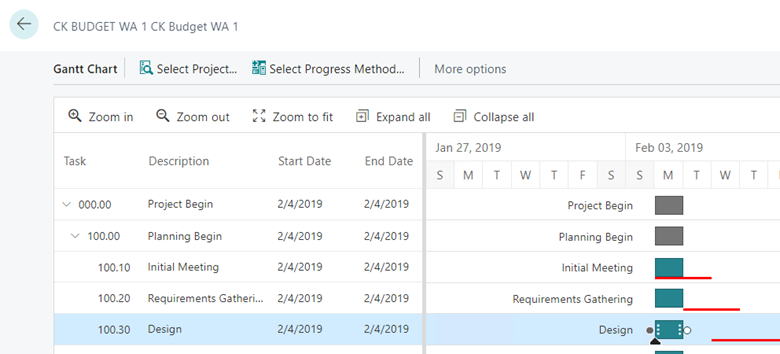
Drag-and-drop the small circle on the right side of a Taskbar.