Resource Reports
There are several reports available under the Role Center > Resource Reports.
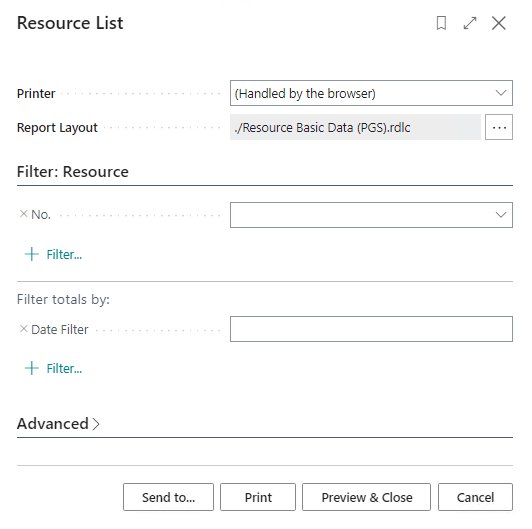
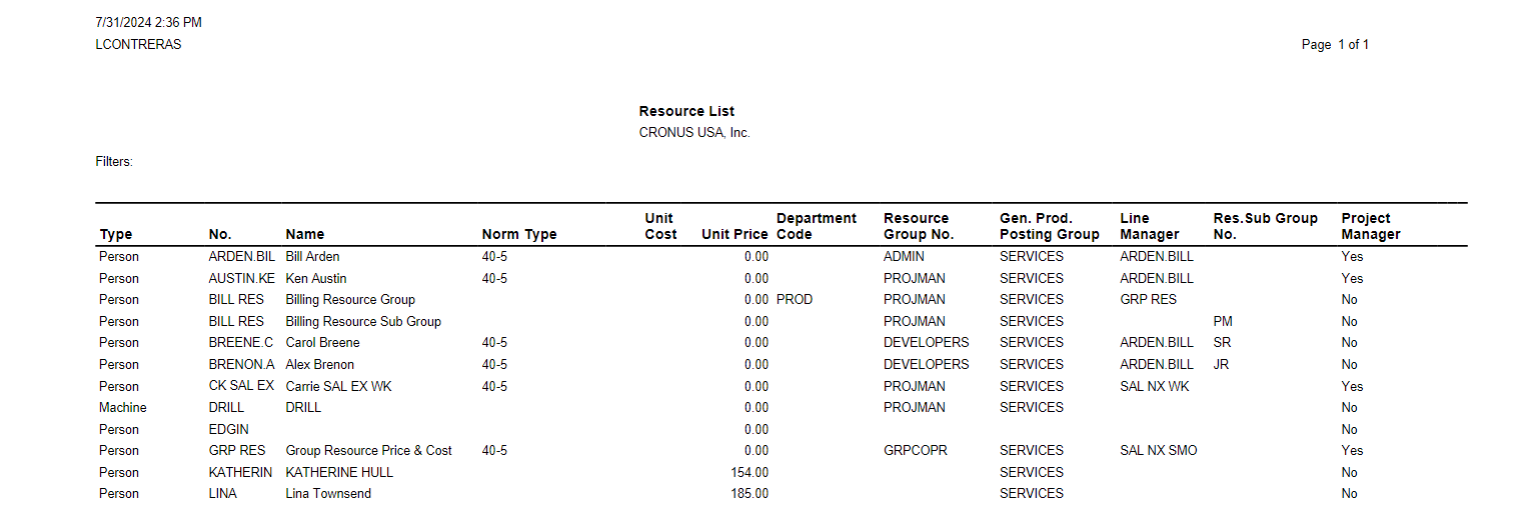
Resource List
This report provides a list of Resources.
Options:
- To filter the report for one Resource, click the No. field drop-down under Filter:Resource and select a Resource.
- Under Filter Totals by: Enter a Date range in the Date Filter enter a Date range to narrow report results by Date.
- Click desired print option to generate the report.
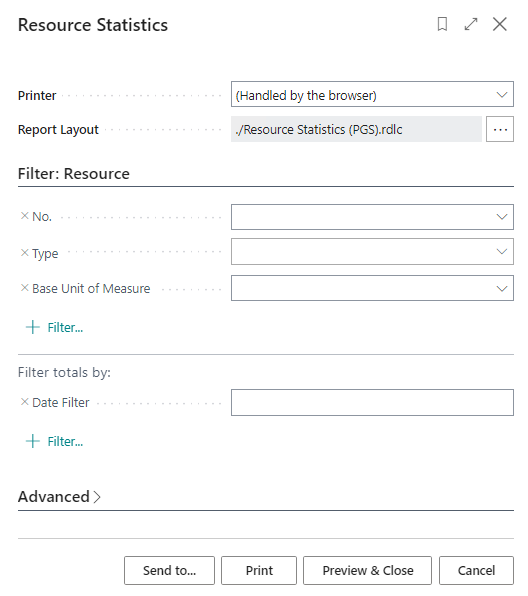
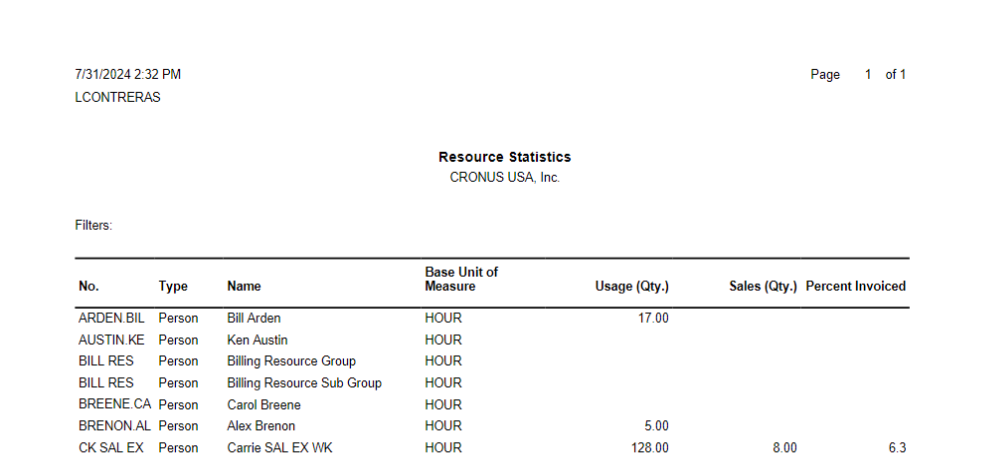
Resource Statistics
View unit and dollar Statistics by Resource.
Resource Statistics Options
Resource - Statistics Filter: Resource
- No. To filter the report for one Resource, click the No. field drop-down under Filter:Resource and select a Resource.
- Type: To filter the report for a specific Resource Type click the Type drop-down and select either Person or Machine. If no filter is selected the report will include both Types.
- Base Unit of Measure: To filter the report for a specific Base Unit of Measure click the Base Unit of Measure drop-down and select from the list.
Filter Totals by
- Enter a Date range in the Date Filter to narrow report results by Date.
- Click desired print option to generate the report.
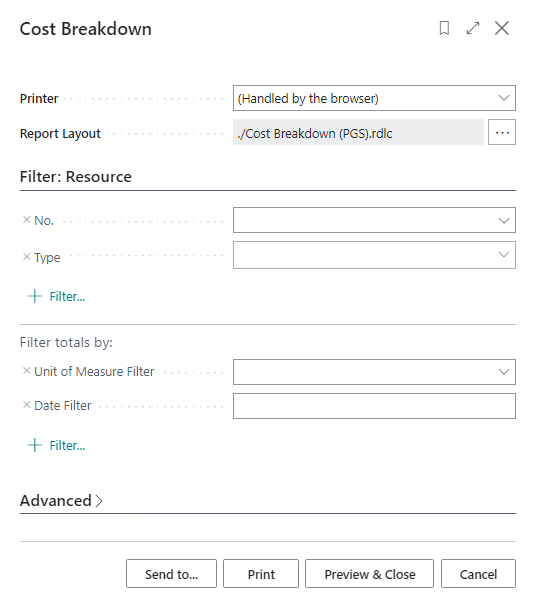
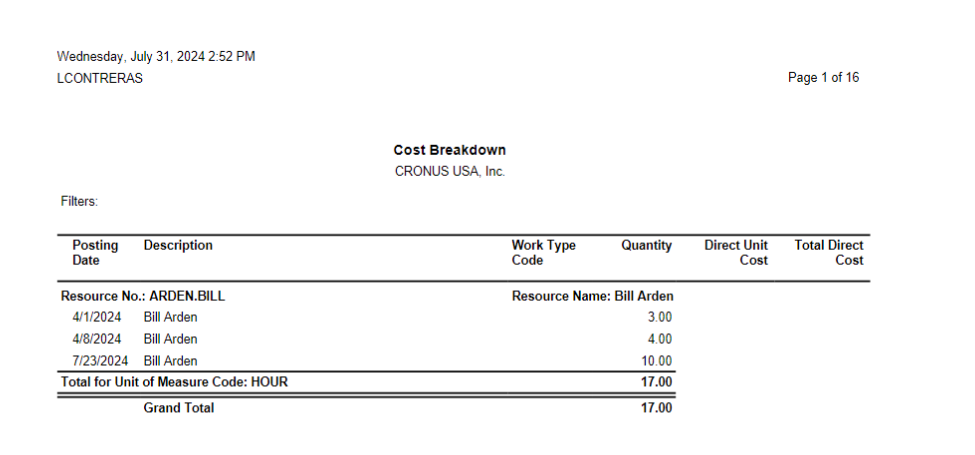
Cost Breakdown
Displays Costs by Resource.
Cost Breakdown Options
Cost Breakdown - Filter: Resource
- No. To filter the report for one Resource, click the No. field drop-down under Filter:Resource and select a Resource.
- Type: To filter the report for a specific Resource Type click the Type drop-down and select either Person or Machine. If no filter is selected the report will include both Types.
Filter Totals by:
Base Unit of Measure: To filter the report for a specific Base Unit of Measure click the Base Unit of Measure drop-down and select from the list.
Enter a Date range in the Date Filter to narrow report results by Date.
Click desired print option to generate the report.
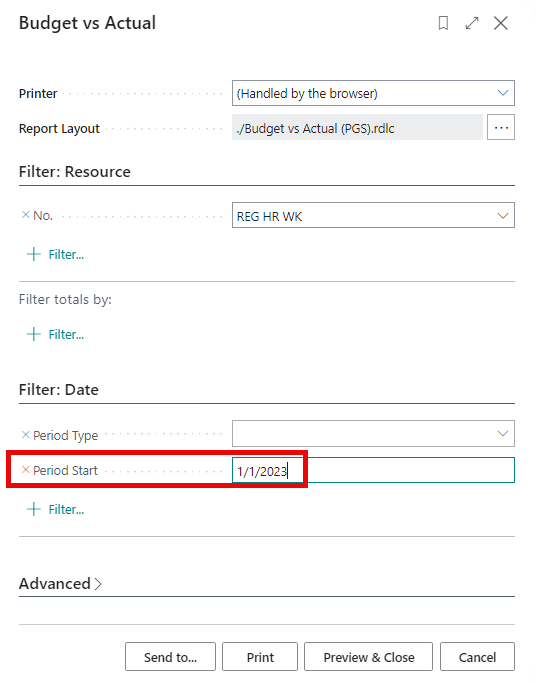
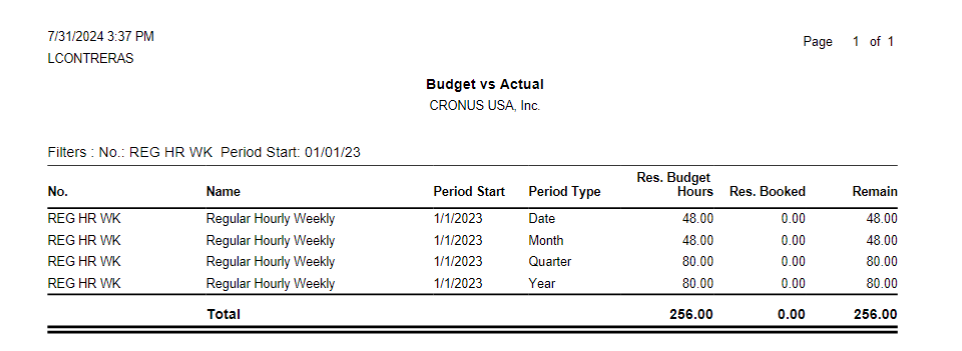
Budget vs. Actual
This report to shows a comparison of Project Budget vs. Actual Amounts.
Budget vs. Actual Options
Budget vs. Actual - Filter: Resource
- No. To filter the report for one Resource, click the No. field drop-down under Filter:Resource and select a Resource.
Filter Totals by:
Period Type: Select a Period Type (Date, Week, Month, Quarter, Year) from the drop-down list to narrow report results by Period Type.
Period Start: (Required) Enter a Period Start date to narrow report results by Period Start.
Click desired print option to generate the report.
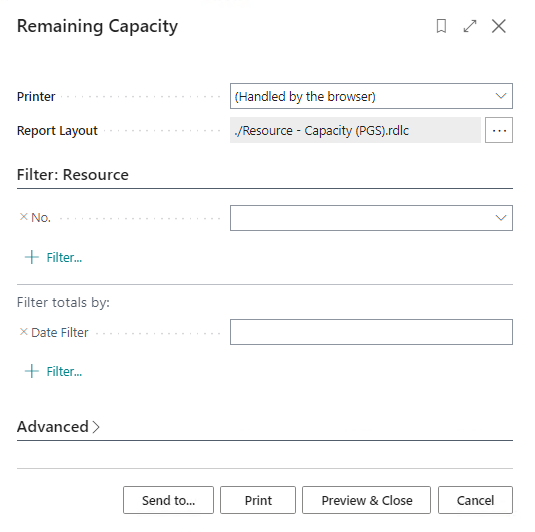
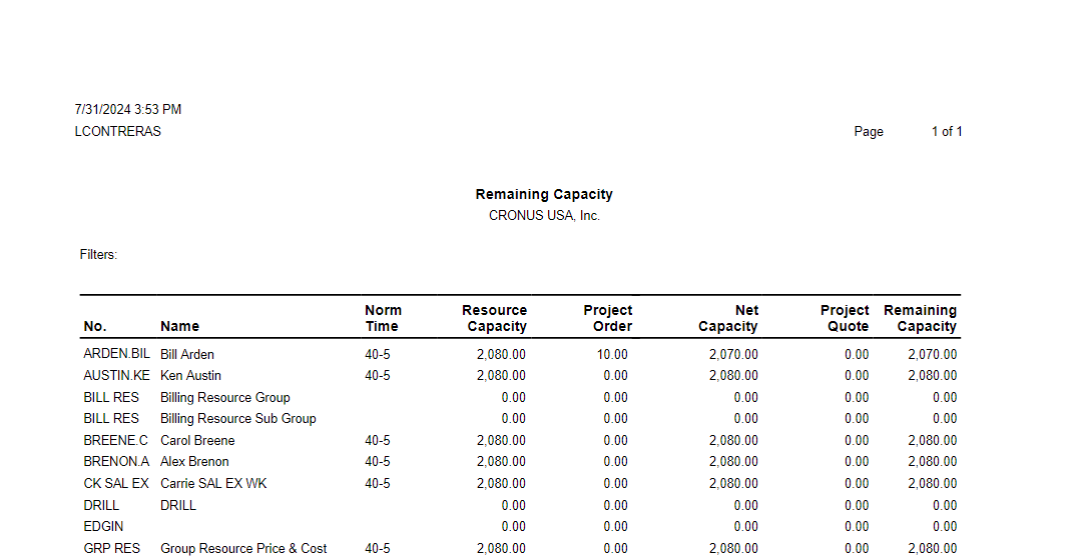
Remaining Capacity
View Resource Capacity compared to Budgeted Units.
Remaining Capacity Options
Remaining Capacity - Filter: Resource
No.: To filter the report for one Resource, click the No. field drop-down under Filter:Resource and select a Resource.
Filter Totals by:
Date Filter: Enter a date in the Date Filterfield to narrow report results by Date.
- Click desired print option to generate the report.
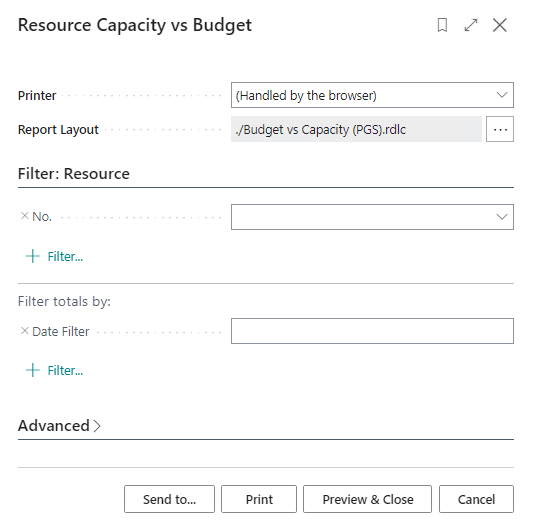
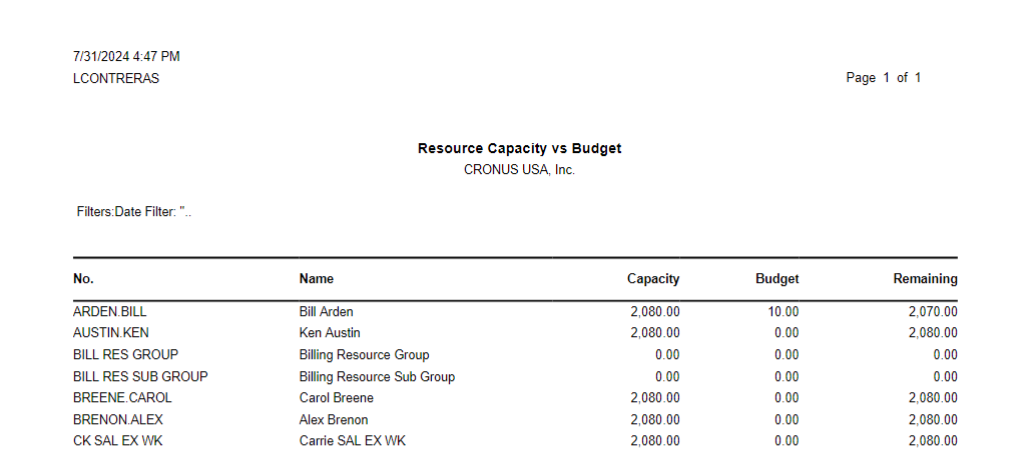
Resource Capacity vs. Budget
Run this report to show Resource capacity compared to Budgeted Units.
Resource Capacity vs. Budget - Options
Resource Capacity vs. Budget - Filter: Resource
No.: To filter the report for one Resource, click the No. field drop-down under Filter:Resource and select a Resource.
Filter Totals by:
Date Filter: Enter a date in the Date Filterfield to narrow report results by Date.
- Click desired print option to generate the report.
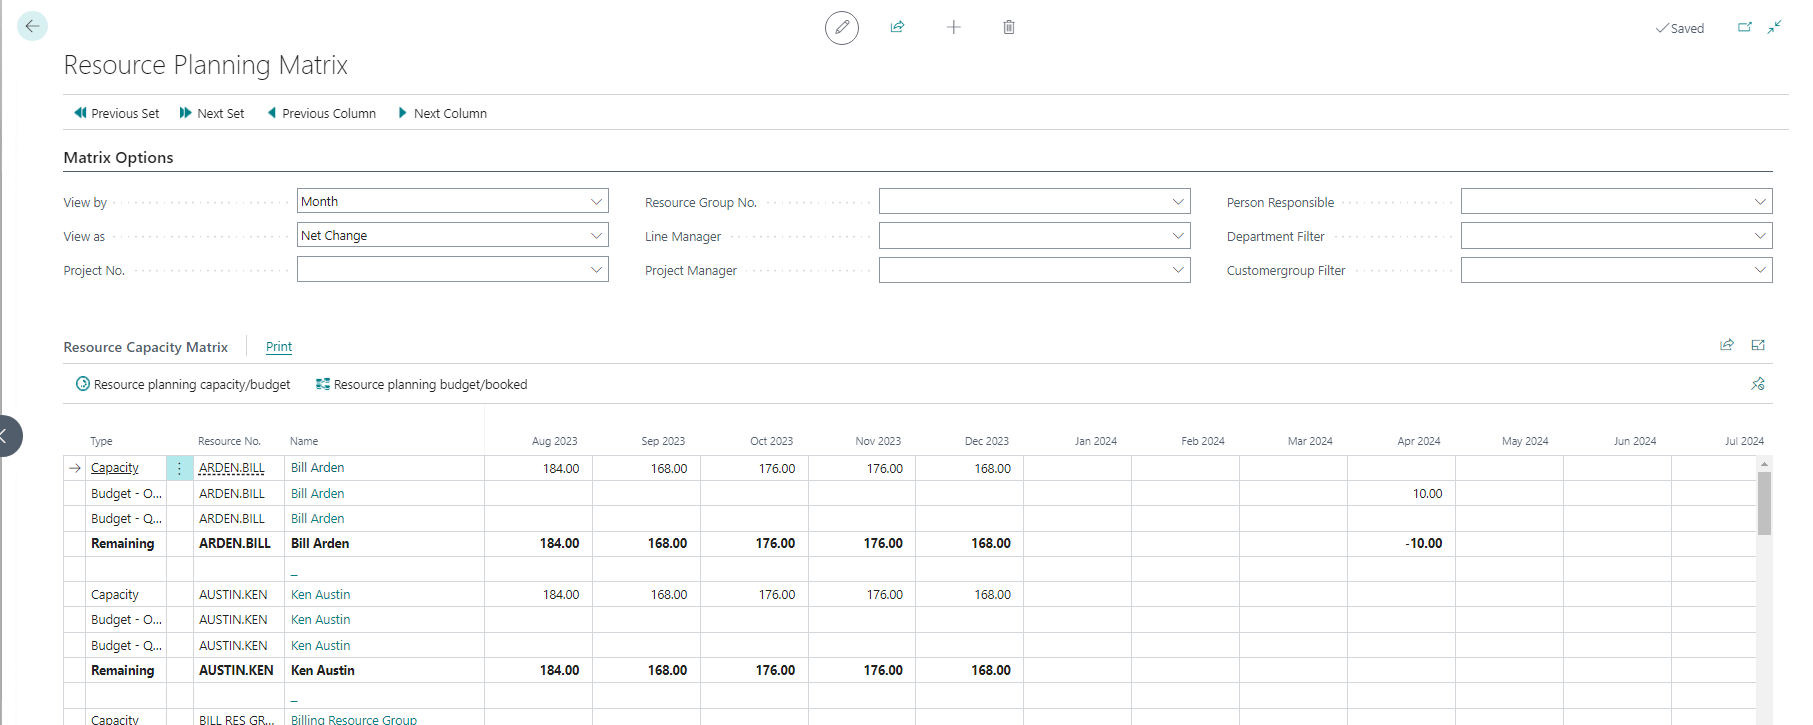
Resource Planning Matrix
Provides Resource information for planning. Use the Matrix Options section to filter results displayed in the Resource Capacity Matrix section at the bottom. Use the navigation buttons in the ribbon (Previous Set, Next Set, Previous Column, Next Column) to scroll between Resource Capacity Periods.
Timesheet Status Analysis
This report is used to analyze time entry hours by Timesheet Status, presented in a Resource Matrix overview. The color and formatting of the text changes to help the user visualize certain conditions.
| Field Name | Description |
|---|---|
| View by | Specifies by which period amounts are displayed. Options: |
| - Day | |
| - Week | |
| - Month | |
| - Quarter | |
| - Year | |
| - Accounting Period | |
| View as | The View as options offer the following filters of the data: |
| View as | Data Shown | Data shown in () | Color Visualization |
|---|---|---|---|
| Hours Open on Timesheet-(Capacity) |
Hours on Timesheet with Status = Open, the hours have not been submitted. |
Capacity | Open hours on Timesheet as % of capacity: green >= 100; black >= 80; red < 80. |
| Hours Submitted | Hours on Timesheet with Status = Waiting XX Approval – XX = PM, LM, or PE OR Status = Waiting Posting (in journal). | - | All hours shown in red. |
| Hours Rejected | Hours on Timesheet with Status = Rejected | - | All hours shown in red. |
| Hours Approved-(Capacity) | Hours on Timesheet with Status = Posted, usage has been created. | Capacity | Hours Approved as % of capacity: green >= 100; black >= 80; red < 80. |
| Hours Total-Warning) | Total Hours | - | Total hours as % of capacity: green >=100; black >=90; red <90 |
Note
Hours Total-(Warning) An Alert icon is shown if there are hours on a Timesheet that are not posted. Clicking on the quantity, which includes the Alert icon, displays the Timesheet lines that are not posted.
![]()
![]()
Line Filters
Use the Line Filters section to add additional filters to narrow displayed results.
| Field Name | Description |
|---|---|
| Resource Group No. |
Specifies which Resource Group lines are displayed. |
| Line Manager | Specifies which Line Manager lines are displayed. |
| Global Dimension 1 | Specifies by which Global Dimension data is shown. Global Dimensions are the Dimensions that you analyze most frequently. Two Global Dimensions, typically for the company's most important activities, are available on all cards, documents, reports, and lists. |
| Global Dimension 2 | Specifies by which Global Dimension data is shown. Global Dimensions are the Dimensions that you analyze most frequently. Two Global Dimensions, typically for the company's most important activities, are available on all cards, documents, reports, and lists. |
Entry Filters
| Field Name | Description |
|---|---|
| Project No. |
Specifies which Project No. lines will be displayed. |
| Project Manager | Specifies which Project Manager lines will be displayed. |
| Person Responsible | Specifies which Person Responsible lines will be displayed. |
| Global Dimension 1 | Specifies by which Global Dimension data is shown. Global Dimensions are the Dimensions that you analyze most frequently. Two Global Dimensions, typically for the company's most important activities, are available on all cards, documents, reports, and lists. |
| Global Dimension 2 | Specifies by which Global Dimension data is shown. Global Dimensions are the Dimensions that you analyze most frequently. Two Global Dimensions, typically for the company's most important activities, are available on all cards, documents, reports, and lists. |
Usage Analysis
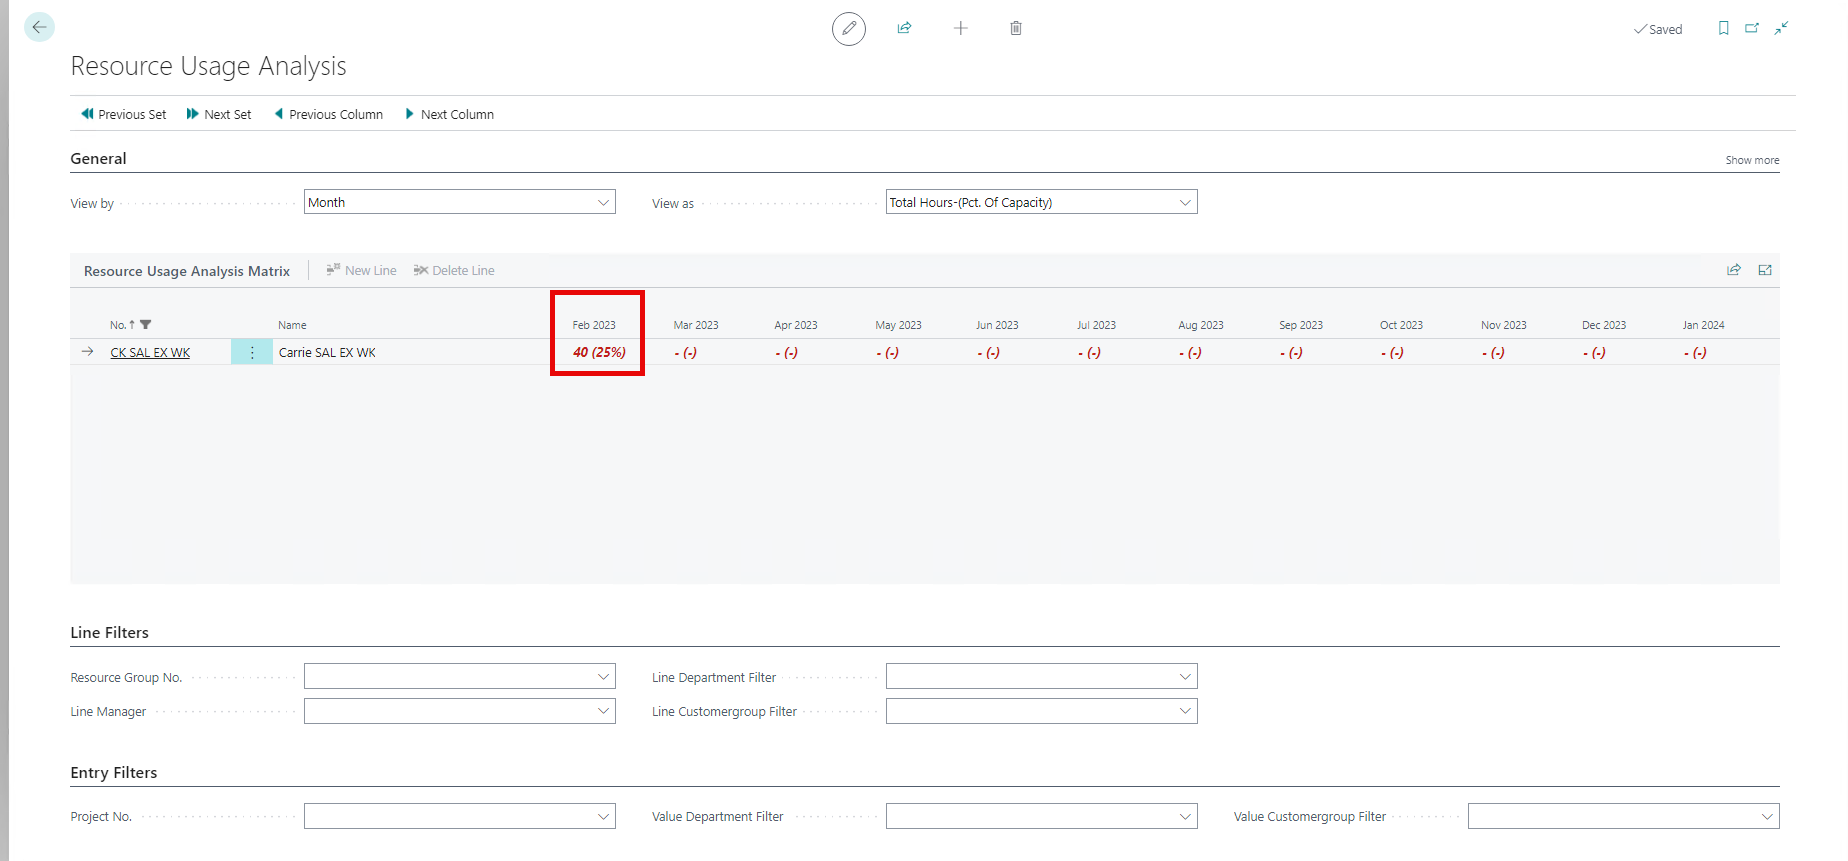
Use this report to analyze posted time entries, presented in a Resource Matrix where the color and formatting of the text changes to help the user visualize certain conditions. For example, to view total hours as a percentage of capacity, select Total Hours-Pct of Capacity), which will display in Red (italicized) or Green to indicate Customer Hours vs. Capacity. in the screenshot below, the 40 hours posted represents 25% of the Resource's total capacity for the month (160 hours), so it displays in red as 40(25%).
| Field Name | Description |
|---|---|
| View by | Specifies by which period amounts are displayed. Options: |
| - Day | |
| - Week | |
| - Month | |
| - Quarter | |
| - Year | |
| - Accounting Period | |
| View as | The View as options offer the following filters of data: |
| - Day | |
| - Week | |
| - Month | |
| - Quarter | |
| - Year | |
| - Accounting Period |
| View as | Data Shown | Data Shown in () | Color Visualization |
|---|---|---|---|
| Total Hours-(Pct. of Capacity) |
Displays the Total Timesheet Hours posted as % of capacity. |
Capacity | Total Project hours on Timesheet as % of capacity: Green >= 100; Black >= 80; Red < 80. |
| Customer Hours-(Pct. of Capacity) | Displays the Timesheet Hours posted to Customer Projects. | Capacity | Customer Project hours on Timesheet as % of capacity: Green > >= 100; Black >= 80; Red < 80. |
| Internal Hours | Timesheet Hours posted to Internal Projects | - | All hours displayed in Green. |
| Billable Hours-(Pct. of Capacity) | Displays billable Project Hours on Timesheet as % of capacity | Capacity | Green >= 100; Black >= 80; Red < 80. |
| Non-Billable Hours | Displays non-billable Timesheet Hours (Chargeable = False) posted to a Project; Chargeable = False. | All hours displayed in Green |
For Color Visualizations, the following colors/conditions apply:
| Condition | Description |
|---|---|
| Submitted |
Text will display in Green color when >= 100% Capacity. Text will display in Italicized Red color when Submitted Hours < 100% Capacity or no Capacity exists. |
| Approved | Specifies Approved Hours in % of Total Hours. The text will display in Green color when the Approved Hours >= 100% of Capacity. Text will display in Italicized Red when Approved Hours < 100% of Capacity, or no time is approved. |
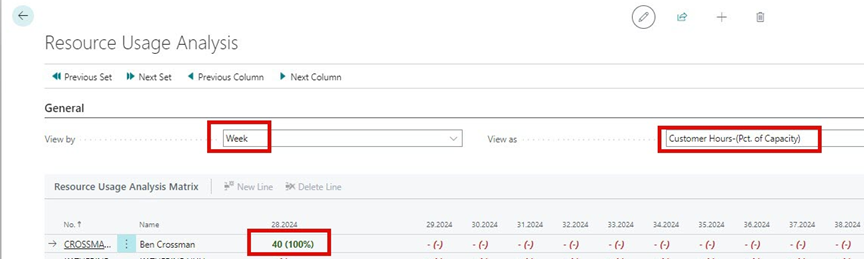
In this first example, the Resource has 40 hours of Capacity entered for week 28-2024, and the View by field is set to Week. The report compares the Resource’s Capacity entries for Week 28 in the year 2024, with their Capacity Hours set up in their Timesheet Configuration, which is 40-5. This determines they are at 100% Capacity for that week, and the text for that week is displayed in Green, as 40(100%).
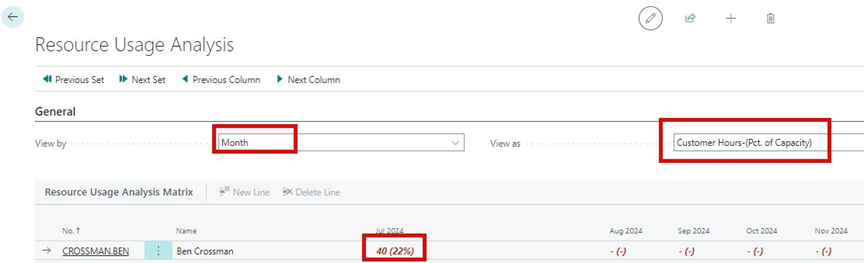
However, if the View by field is changed to Month, instead of Week, the same 40 hours now displays text in Red as 40/22%, which indicates that the Resource’s Capacity for the month is 182 hours and they have only booked 40 hours. The 40 hours entered versus 182 hours Capacity for the month = 22%. The entry now displays that this Resource is only at 22% of their Capacity for the month.
Tip
Click the cell with the numbers to drill down and view the Project Ledger Entries comprising the Alert condition.
Usage Analysis - Line Filters
Use the Line Filters section to add additional filters to narrow displayed results.
| Field Name | Description |
|---|---|
| Resource Group No. |
Specifies which Resource Group lines are displayed. |
| Line Manager | Specifies which Line Manager lines are displayed. |
| Global Dimension 1 | Specifies by which Global Dimension data is shown. Global Dimensions are the Dimensions that you analyze most frequently. Two Global Dimensions, typically for the company's most important activities, are available on all cards, documents, reports, and lists. |
| Global Dimension 2 | Specifies by which Global Dimension data is shown. Global Dimensions are the Dimensions that you analyze most frequently. Two Global Dimensions, typically for the company's most important activities, are available on all cards, documents, reports, and lists. |
Usage Analysis - Entry Filters
| Field Name | Description |
|---|---|
| Project No. |
Specifies which Project No. lines will be displayed. |
| Project Manager | Specifies which Project Manager lines will be displayed. |
| Person Responsible | Specifies which Person Responsible lines will be displayed. |
| Global Dimension 1 | Specifies by which Global Dimension data is shown. Global Dimensions are the Dimensions that you analyze most frequently. Two Global Dimensions, typically for the company's most important activities, are available on all cards, documents, reports, and lists. |
| Global Dimension 2 | Specifies by which Global Dimension data is shown. Global Dimensions are the Dimensions that you analyze most frequently. Two Global Dimensions, typically for the company's most important activities, are available on all cards, documents, reports, and lists. |
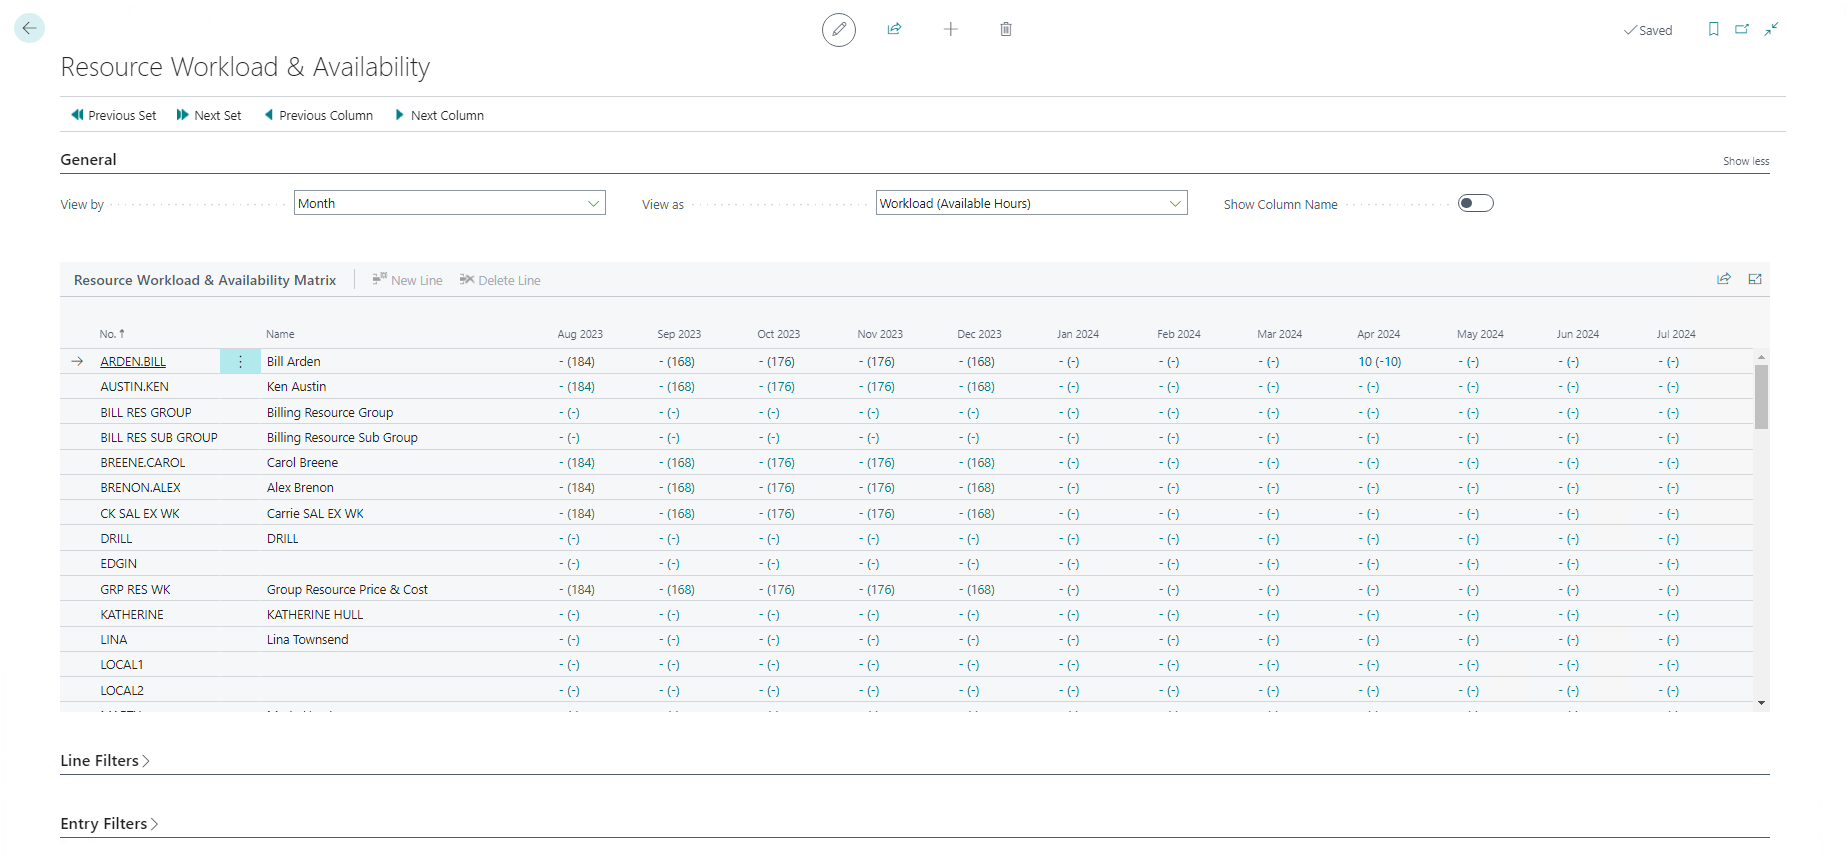
Workload & Availability
Analyze budget and planning entries with additional filters to limit the display, as an example, to Resource Group or Line Manager. View Resource Workload based on individual Outlook entries.|
| Field Name | Description |
|---|---|
| View by |
Specifies by which period amounts are displayed. Options: |
| - Day | |
| - Week | |
| - Month | |
| - Quarter | |
| - Year | |
| - Accounting Period | |
| View as | The View as options specifies hours in actual budgets planned for the Resource. Workload specifies the budgeted hours (Type = Order) on the Resource, (Available Hours) specifies the Resource Capacity minus the Workload Hours. View as filters: |
| - Day | |
| - Week | |
| - Month | |
| - Quarter | |
| - Year | |
| - Accounting Period |
| View as | Data Shown | Data Shown in () | Color Visualization |
|---|---|---|---|
| Order |
Description |
Data Shown |
Colors |
| Quote | Description | Data Shown | Colors |
| Order and Quote | Description | Data Shown | Colors |
| Calendar | Description | Data Shown | Colors |
| Workload (Available Hours) | Description | Data Shown | Colors |